A beginner’s guide to Google Analytics 4 [2024]
I may get paid commission for purchases made after clicking a link in this post.
So you have set up Google Analytics 4, but how do you actually use it? In this beginner’s guide to Google Analytics 4, I show you how to find your way around Google Analytics 4 and where to find the most important and useful information.

Google Analytics 4 – cautionary advice!
In this tutorial, I am going to take you through the basics of Google Analytics 4 – how to find your way around, where to find the most important and useful information, and how to understand and interpret that information.
But before I do, I want to sound a note of caution. Because, while Google Analytics can give you lots of useful data, it can also give you a major information overload! There are just so many metrics, variables, options and customization possibilities it can feel incredibly overwhelming.
The truth is, you almost certainly don’t need most of this data.
When it comes to Google Analytics 4, it is SUPER IMPORTANT that you take a small step back to gain a little perspective. In particular, take a moment to think about what your goals are and what data you REALLY need… and when you start to find yourself falling down a data rabbit hole, ask yourself ‘Why?’ and ‘What am I going to use this data for?’ If you can’t answer those questions, get out of the rabbit hole! Your time is finite and – for most bloggers – getting lost down a Google Analytics rabbit hole is not a good use of it!
You are also likely to find there are some blogging and SEO ‘gurus’ out there who will tell you that you really need a super advanced knowledge of Google Analytics 4 and that you should be spending hours poring over your analytics each week in order to be a successful blogger.
The truth is, most bloggers do not need a super advanced level of knowledge when it comes to Google Analytics, nor do they need to spend hours poring over the data. Most bloggers need only a basic understanding of Google Analytics and they only need to keep an eye on a very small number of metrics. In this tutorial, I am going to share with you how to find and monitor that small number of metrics, freeing you up to do much more useful things with your time than tying yourself in knots over Google Analytics!
Google Analytics 4, simplified
This tutorial is not meant to be an all-encompassing tutorial on everything you can possibly do with Google Analytics 4, but rather a crash course in the basics. My aim is to help you understand the basic reports, and where you can find the most important and useful information. As well as to help you feel more confident about using Google Analytics 4 and interpreting the data.
More specifically I am going to show you:
- How to find out how many pageviews, sessions and visitors your blog gets
- How to change the dates and compare two different date ranges
- How to discover demographic information about your readers
- How to find out where your readers live
- How to find out what kind of device your readers are using
- How to find out where your traffic is coming from (Google, social media, other websites etc.)
- How to discover which are your top posts and pages (and your worst performing ones!)
- How to find out what % of your readers are new and returning
Once you understand the basics, you can then decide for yourself if you need any information above and beyond the information that can be found in the basic reports. But, as I’ve already mentioned, beware of chasing after data for data’s sake. Always ask yourself ‘Why?’ and ‘What am I actually going to DO with this data?’.
Before you get started…
Before you get started with Google Analytics 4, you will need to set up a Google Analytics account and a Google Analytics 4 property for your website. You will also need to install the Google Analytics 4 tracking code and check that everything is working and data is flowing into your account.
For more help with this, check out these articles:
- How to set up Google Analytics 4 (from scratch)
- How to set up a new Google Analytics 4 property (when you already have a Google Analytics account)
- How to install the Google Analytics 4 tracking code (and check that it’s working)
A beginner’s guide to Google Analytics 4
HOME
This is the first screen you will land on when you log in to your Google Analytics account. On this screen you will be able to see some basic information at a glance.
The first section is by far the most useful. Here, you will be able to see some basic information about the past 7 days. This section is ‘intelligent’, so Google will give you the metrics it thinks you most want to see. For example, it might show Views (AKA pageviews), Users, Sessions and Engaged Sessions.
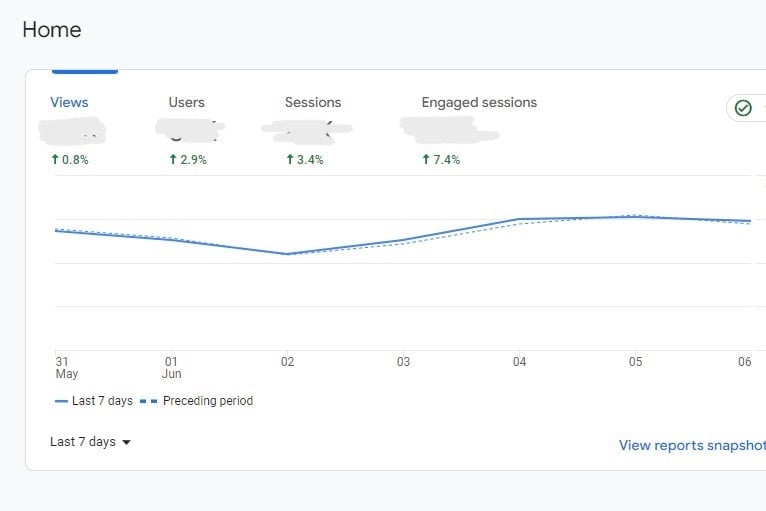
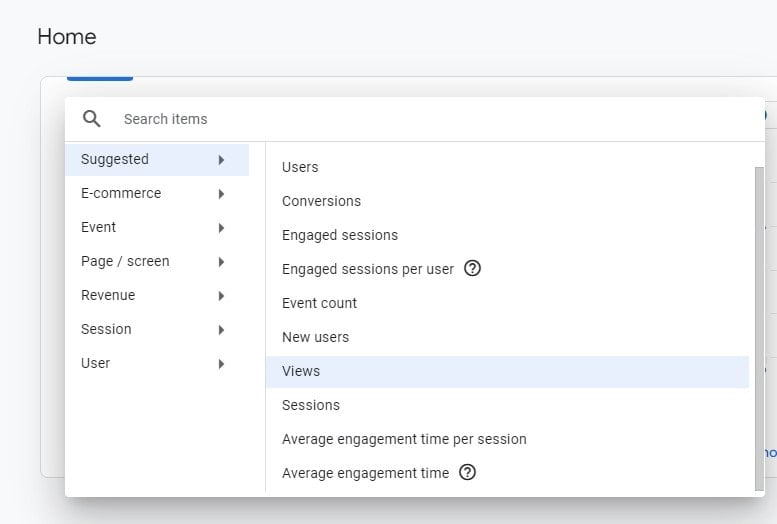
If you don’t like what Google is showing you, you can choose different metrics to look at. Simply hover over a metric (e.g. Views), click the dropdown arrow and you will get lots of different options.
Another thing you can do here is change the date range. Simply click the dropdown arrow next to ‘Last 7 Days’ and you can select from several useful preset date ranges – last 30 days, last 12 months, last year etc. Alternatively you can select ‘Custom’ to select a specific date range.
Other things that typically appear on the HOME screen are:
- Users In The Last 30 Minutes (Unfortunately, due to the way GA4 data is collected, this is not very accurate)
- Recently Accessed (Reports you have recently looked at – more about reports below)
- Suggested For You (Reports Google thinks you might be interested in looking at)
Because this whole screen in ‘intelligent’, exactly what you see here will vary.
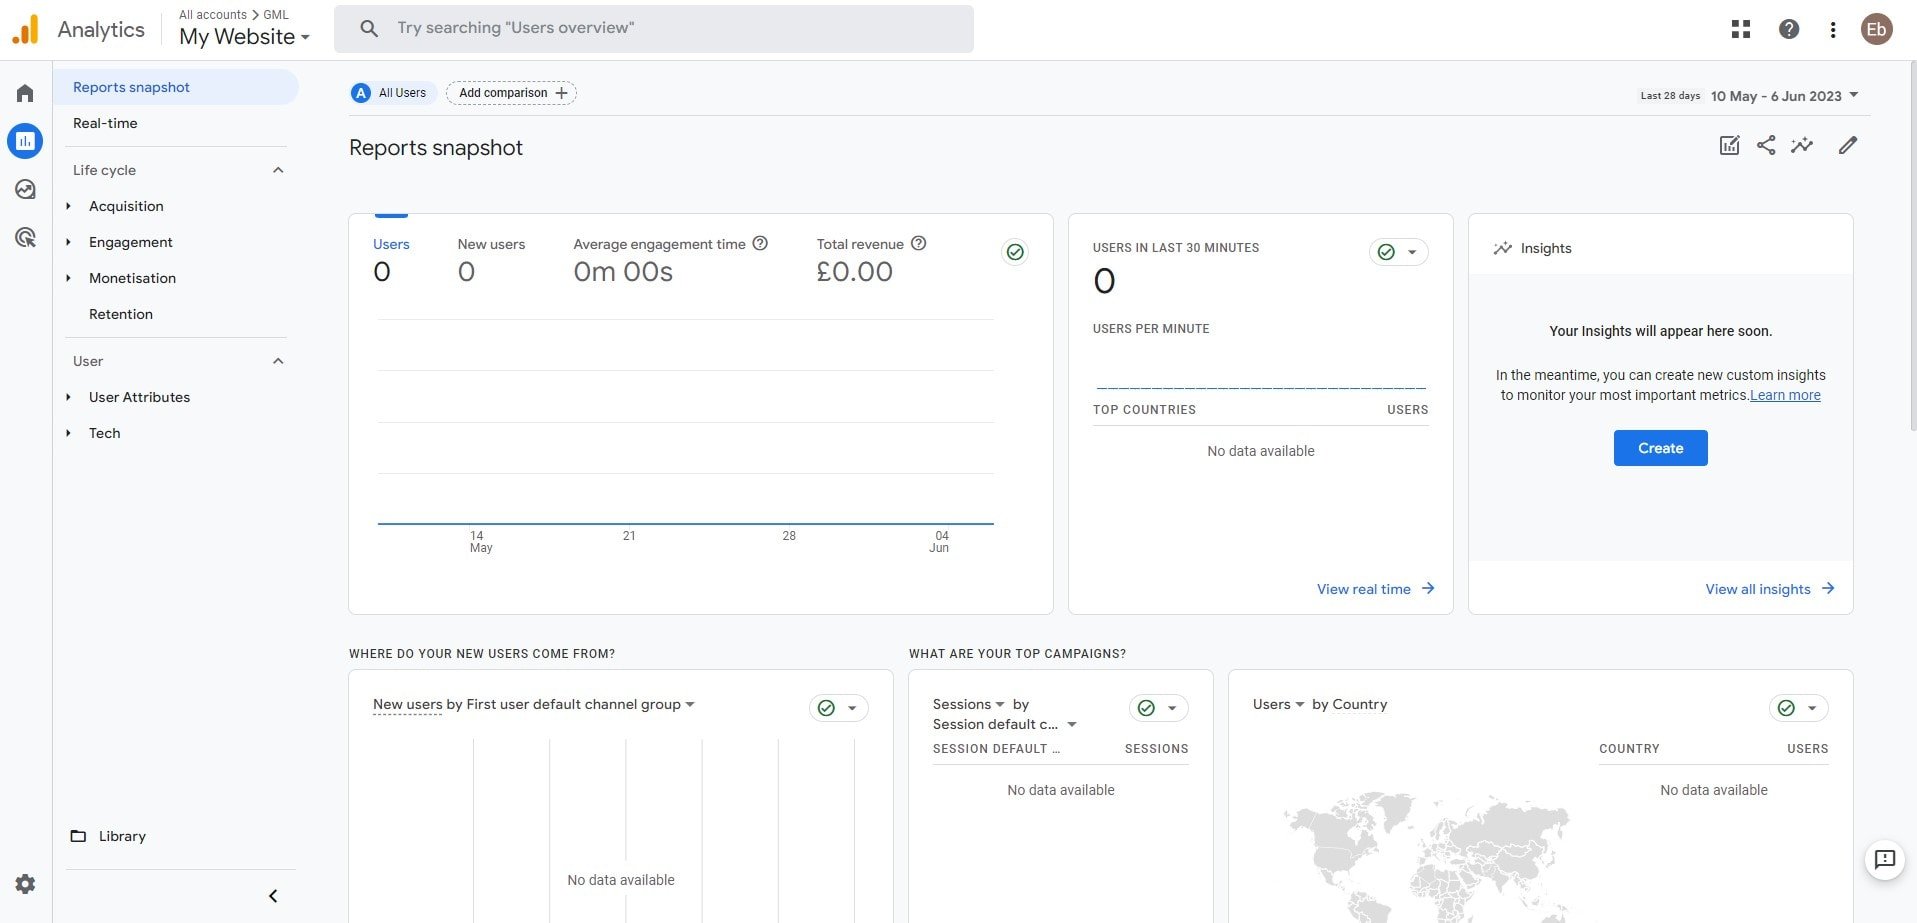
REPORTS => REPORTS SNAPSHOT
This is – as the name suggests – a ‘snapshot’ of some the reports available in Google Analytics.
With each ‘snapshot’, you can click on the VIEW link in the bottom right hand corner of the snapshot to go to the full report.
It’s likely that most of the time you will go directly to the report you want, but it’s helpful to know this reports snapshot is here if you just want a quick overview of what’s going on.
The other important detail to note is that the date range defaults to Last 28 Days, but you can change the date range in the top right hand corner.
REPORTS => REAL TIME
In theory, the Real Time report gives you some ‘real time’ information about what’s happening on your blog right now. Unfortunately, because of the way GA4 collects data, it is not very accurate. So I don’t recommend you pay much attention to this or worry about it unduly.
There is one useful thing this report gives you and that is peace of mind that your tracking code is working and data is flowing into your GA4 account.
REPORTS => ACQUISITION => TRAFFIC ACQUISITION
There are 3 reports under acquisition: Overview, User Acquisition and Traffic Acquisition.
In my opinion, Traffic Acquisition is by far the most useful. Overview, as you would expect, gives you an overview, while User Acquisition tells you how you get new users for the first time.
Most bloggers just want to know where their traffic is coming from – both new and returning users – and that’s what Traffic Acquisition tells you.
It will show you, for example, how much of your traffic is coming from Organic Search, Direct, Social Media, Referral and so on.
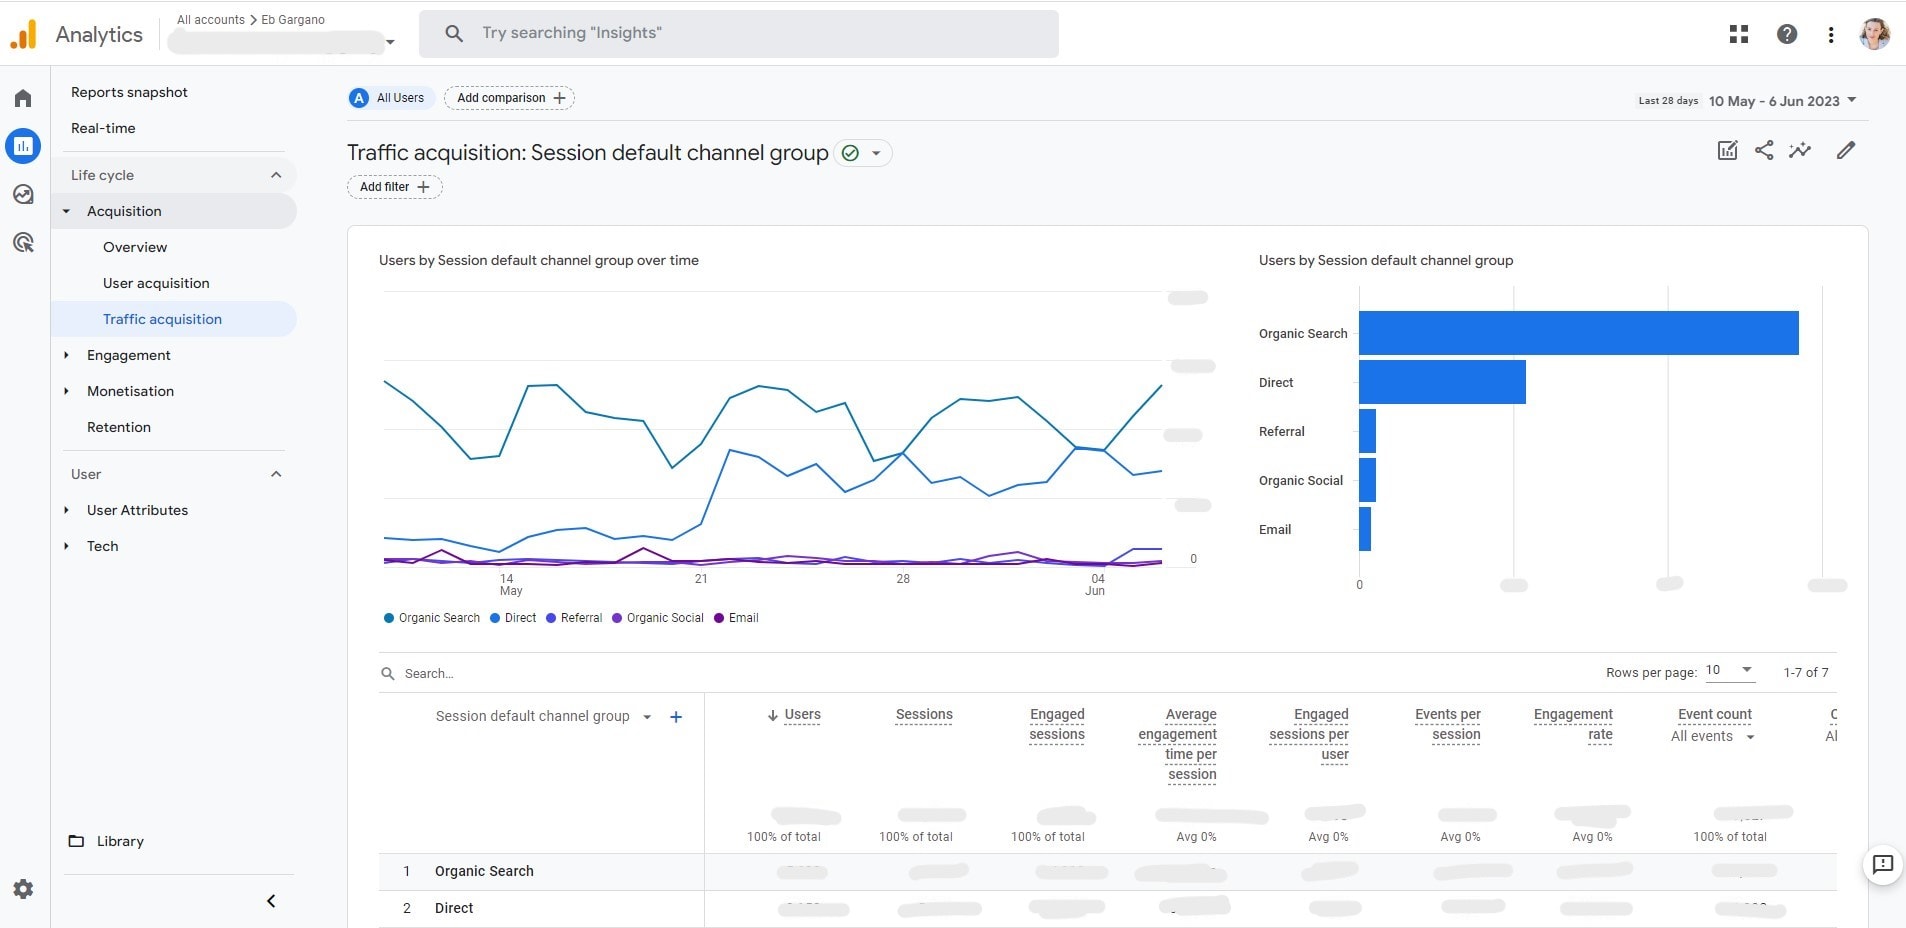
As with most reports, the default date range is Last 28 Days, but you can change this in the top right hand corner.
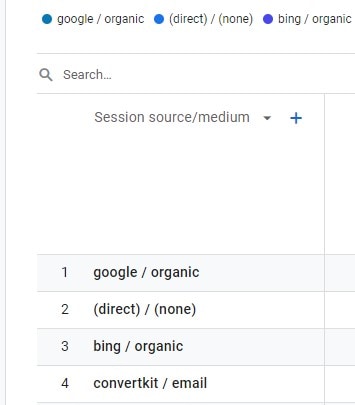
It’s also worth knowing that by default this report shows Session Default Channel Group, but you can change this in the dropdown at the top of the table. For example, you can change this to show Session Source/Medium – which will allow you to see which search engines are sending you traffic and exactly where you are getting referral and social media traffic from.
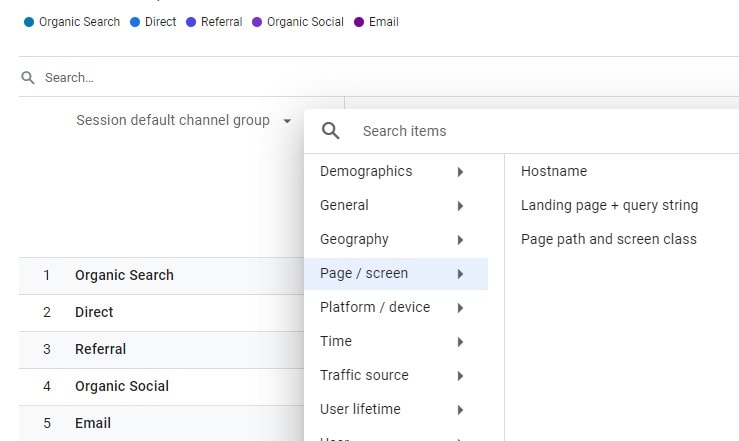
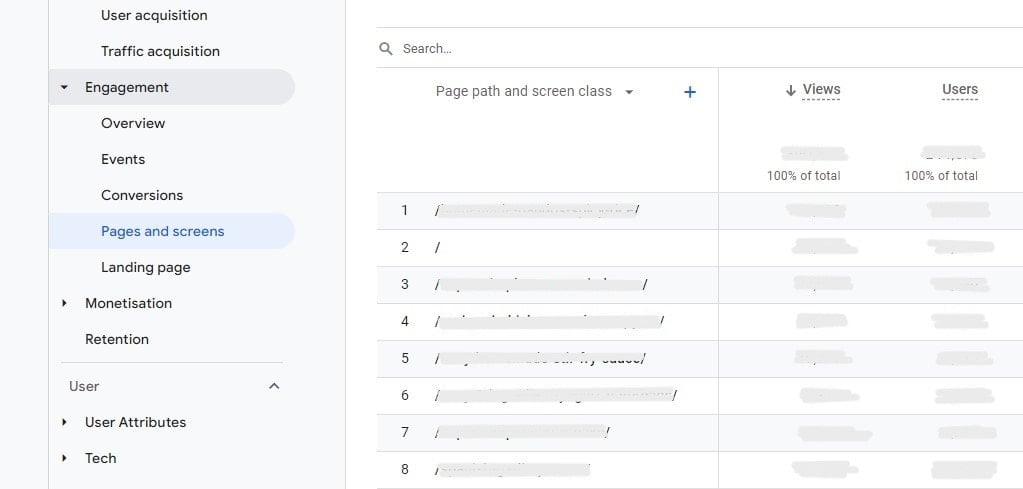
Another useful feature of the Traffic Acquisition Report is that you can add a second dimension. The most useful of these, in my opinion, is ‘Page Path And Screen Class’. This will show you where that traffic is going.
To access this, click the blue cross at the top of the table and select PAGE / SCREEN >>> PAGE PATH AND SCREEN CLASS. (Ignore the funny name – it basically just means ‘page’. ‘screen class’ relates to apps, so is completely irrelevant in the context of a website.)
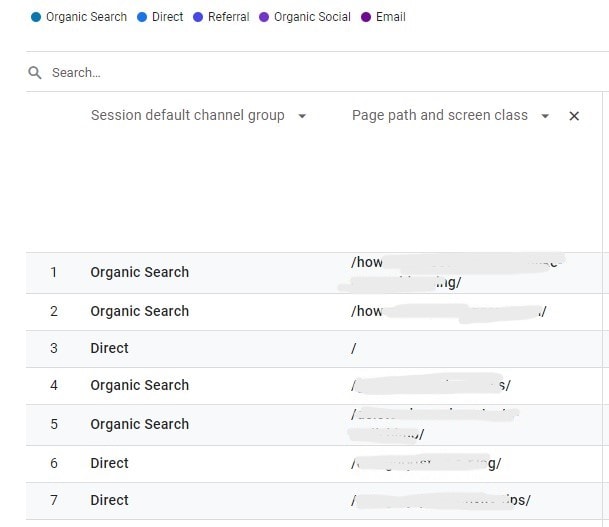
The table will now change and look like this…
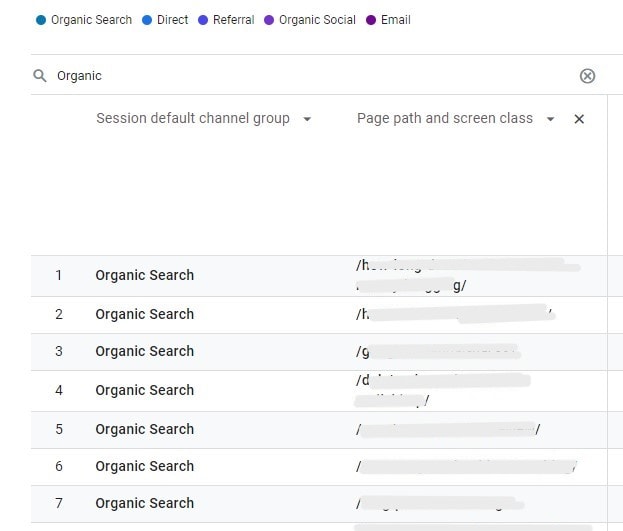
You can then use the search facility to search for ‘Organic Search’. This will then show you your top pages and traffic for all traffic that arrived via Organic Search. (Which is what you are really interested in when you are working on your SEO!)
REPORTS => ENGAGEMENT => PAGE PATH & SCREEN CLASS
There are several reports under engagement, but in my opinion, Page Path and Screen Class is by far the most useful – this tells you what your most (and least!) popular posts are.
The most helpful part of this report is the table which, by default, lists all your blog posts and pages from most to least pageviews.
If you prefer to see this information sorted from lowest to highest pageviews, simply click on the arrow next to ‘views’. If you prefer to see this information by users instead, simply click the arrow next to ‘users’.
Again, you can add a secondary dimension by clicking on the blue plus sign next to ‘Page Path and Screen Class’. For example, if you want to see only organic search traffic, simply click the blue plus sign and select TRAFFIC SOURCE >>> FIRST USER SOURCE / MEDIUM. Then type ORGANIC into the search bar if you just want to see all your organic search engine traffic in order of most to least pageviews. Or type GOOGLE into the search bar if you just want to see all your Google traffic in order of most to least pageviews.
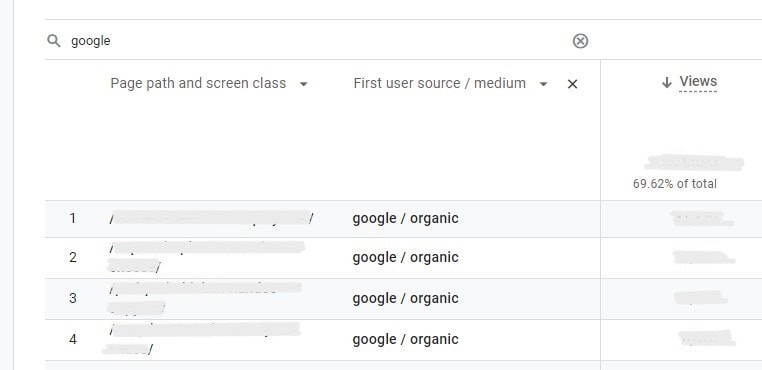
You will also notice that when you do this, the % of total traffic appears under ‘Views’. So, in my example above, you can see that my Google traffic accounts for 69.62% of my total traffic.
Like with previous reports, the default date range is Last 28 Days, but you can change this in the top right hand corner.
REPORTS => ENGAGEMENT => LANDING PAGE
The other report you may find useful under ‘Engagement’ is the ‘Landing Page’ report. This is very similar to the ‘Page Path and Screen Class’, except it only shows the first post or page your readers land on and is not concerned with any posts or pages they may go to AFTER they have viewed the first page. Because of this, the total pageviews on the ‘Landing Page’ report will be less than the total pageviews on the ‘Page Path and Screen Class’ report – because the ‘Landing Page’ report is only concerned with the FIRST page and the ‘Page Path and Screen Class’ report is concerened with ALL pages, and obviously some of your readers will view a second, third, fourth etc. page.
REPORTS => RETENTION
The most useful part of this report is the very first graph – this shows you how many NEW users vs how many RETURNING users you’ve had in the period specified. (Again, this defaults to Last 28 Days but you can change it to be whatever you want it to be in the top right hand corner – I recommend going for ‘Last 12 Months’.)
Annoyingly there does not seem to be a simple way to turn this into a percentage. But you can easily do this manually. Simply type into Google the following:
(number of returning users/(number of new users + number of returning users)) x 100
For example, if you got 700,000 new users and 300,000 returning users during the date range you selected, this is what you would type into Google…
(300,000/(700,000 + 300,000)) x 100
Which equals 30 – or rather 30%.
So, if these were your figures, it shows that over the last 12 months you got 70% new visitors and 30% returning visitors.
This is an important metric as it shows how many of your readers actually come back! For many reasons, you want a reasonably high % of returning visitors – meaning your readers are not just coming once, getting what they need, and never returning, but rather you are doing a good job at turning them into regular readers.
Among other things, this means you are more protected from Google algorithm changes and future economic shocks. It also actively helps your SEO – either because you are getting branded searches (e.g. ‘Easy Peasy Foodie Chocolate Cake’ rather than just ‘Easy Chocolate Cake’) or because many of those returning visitors will click on your result in the search results first – even if you are not the first result… because they know and trust your blog will give them a good answer.
Hands down the best way to convert casual Google visitors into regular readers… and eventually customers is via Email Marketing.
REPORTS => USER => USER ATTRIBUTES => OVERVIEW
In theory, this section should show demographic information about your users: Country, Town/City, Gender, Interests and Age. Unfortunately, for a couple of different reasons, you may not see any data here.
The first reason is that you don’t have Google Signals turned on. Head here to learn more about what Google Signals is and how to turn it on.
The second reason is because Google has applied Data Thresholding. This is what Google says about Data Thresholding…
“If your report or exploration is missing data, it may be because Google Analytics has applied a data threshold. Data thresholds are applied to prevent anyone viewing a report or exploration from inferring the identity of individual users based on demographics, interests, or other signals present in the data.”
You can read more about Data Thresholding here.
If you do have data here, you can use it to understand more about your users. For example, what % of your readers are male or female, what % of your readers are in each age category and where your readers live.
REPORTS => USER => USER ATTRIBUTES => DEMOGRAPHIC DETAILS => COUNTRY
This report shows you where your readers live, and how this has changed over time. (Again, this report initially defaults to ‘Last 28 Days’, but can be changed in the top right hand corner.)
There are a couple of useful features here…
Firstly, you can see at a glance which countries account for most of your traffic. (This is important if you want to get ads on your site and get the best RPMs because only a small handful of countries have high advertiser spend – for example the US, Canada, the UK and Australia.)
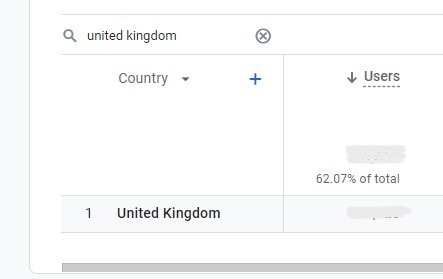
Secondly, you can find out what % of your readers come from a specific country. Do this by typing the country you are interested in into the search bar immediately above the table. For example, if I wanted to know what % of my readers come from the UK, I would type ‘United Kingdom’ into the search bar. I can then look across and see that 62.07% of my traffic comes from the UK over the period I specified.
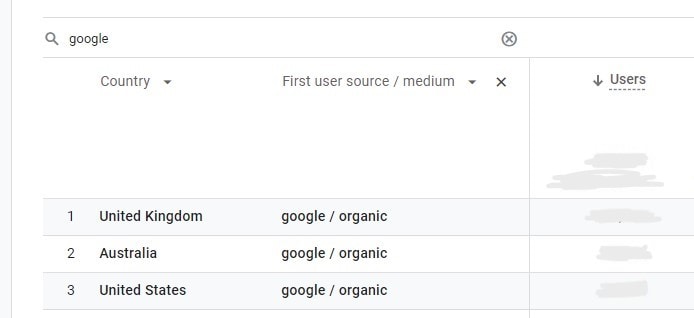
And thirdly, you can again specify a second dimension by clicking the blue plus sign and choosing from a selection of different options . For example, I could specify FIRST USER SOURCE / MEDIUM and then type ‘google’ into the search. This would show me which countries account for most of my Google traffic.
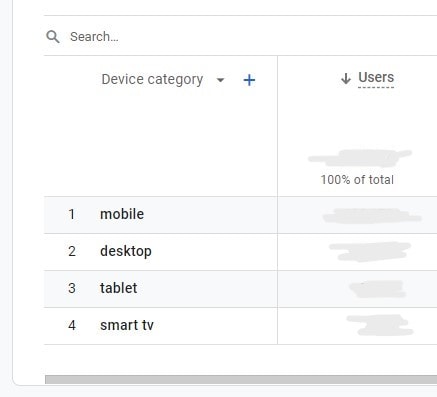
REPORTS => USER => TECH => TECH DETAILS
The final report looks at tech. Under ‘Tech Details’, the default table shows which browsers your readers are using.
If you click the dropdown next to ‘Browser’, you can select other options. I find the most useful option here is ‘Device Category’. This shows me how much of my traffic comes from Mobile, Desktop, Tablet and Smart TV.
Again, this report works similarly to the others, meaning you can choose a secondary dimension, use the search function to filter and change the date range.
Google Analytics 4 – other useful things to know
My aim with this tutorial is to outline the ‘basics’ of Google Analytics, rather than overwhelm you with ‘everything you can do on GA4’ (Which is a) enormous! b) largely not aimed at bloggers, and c) an unnecessary waste of your time.)
However, there are a few other useful details you might like to know once you’ve mastered the basics.
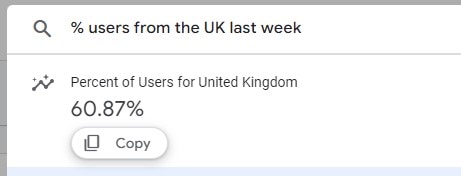
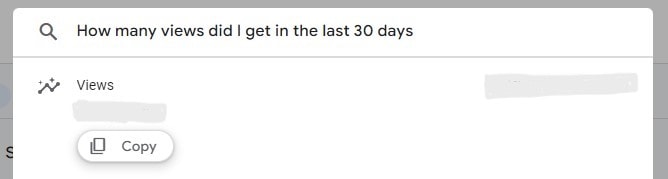
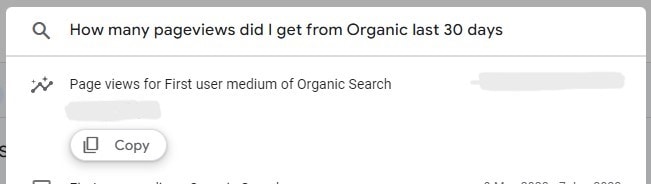
1. You can search for answers
I love this feature! If you know what information you want, but you don’t know where to find it, simply search for it at the top of the page!
So for example, if I wanted to find out what % of my users came from the UK last week, I could type in ‘% readers from UK last week’ and get an instant answer!
Or, if I wanted to know how many pageviews I got in the last 30 days, I could ask ‘How many views did I get in the last 30 days?‘
Or, if I wanted to know how many pageviews I got from organic search engine traffic in the last 30 days, I could ask ‘How many pageviews did I get from organic in the last 30 days?‘
2. You can edit reports
This is getting a bit more technical and beyond the scope of this tutorial, but there are huge possibilities in GA4 to edit reports and create your own custom reports. In any given report, you can simply go to the pencil icon in the top right hand corner (under the date range – if you hover over it, it says ‘Customize Report’) and change what the report shows.
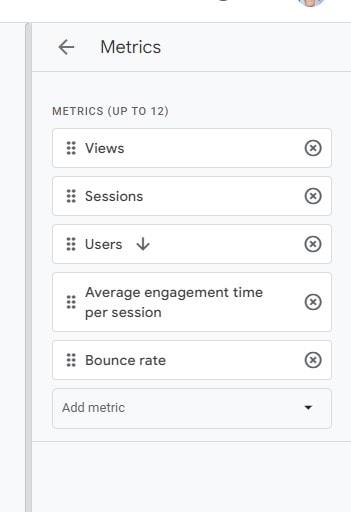
For example, in the Traffic Acquisition report, you could change things up so the report showed different metrics. For example, you could change the metrics to show just Pageviews, Sessions, Users, Engagement Time and Bounce Rate. Like this…
When you are happy with your changes, hit APPLY and then SAVE >>> SAVE AS A NEW REPORT. (This will ensure you don’t lose any of the original reports!) and give it a name.
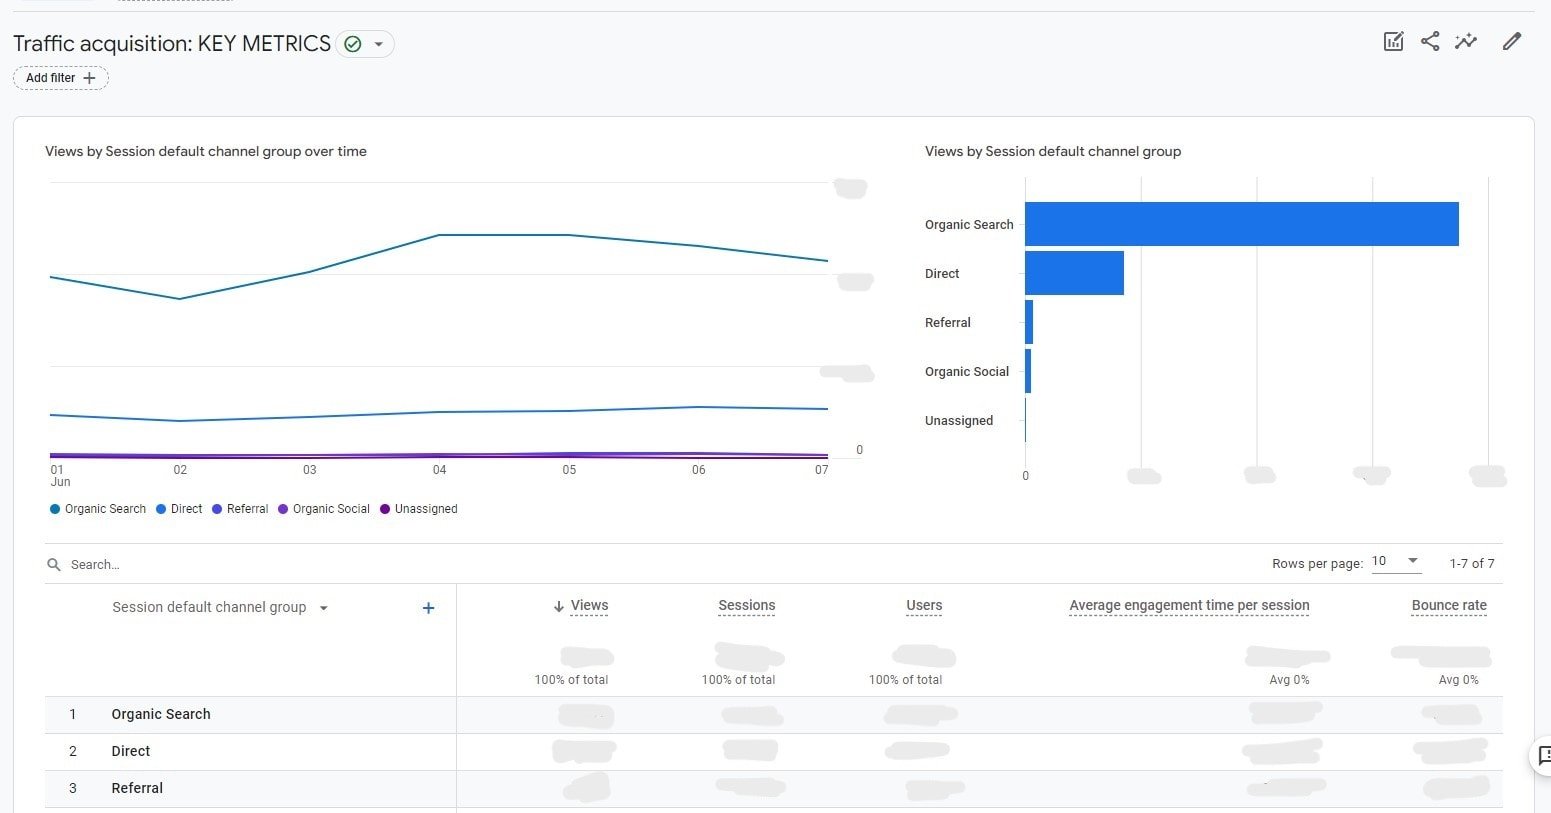
The above example would create a new custom report which looks like this…
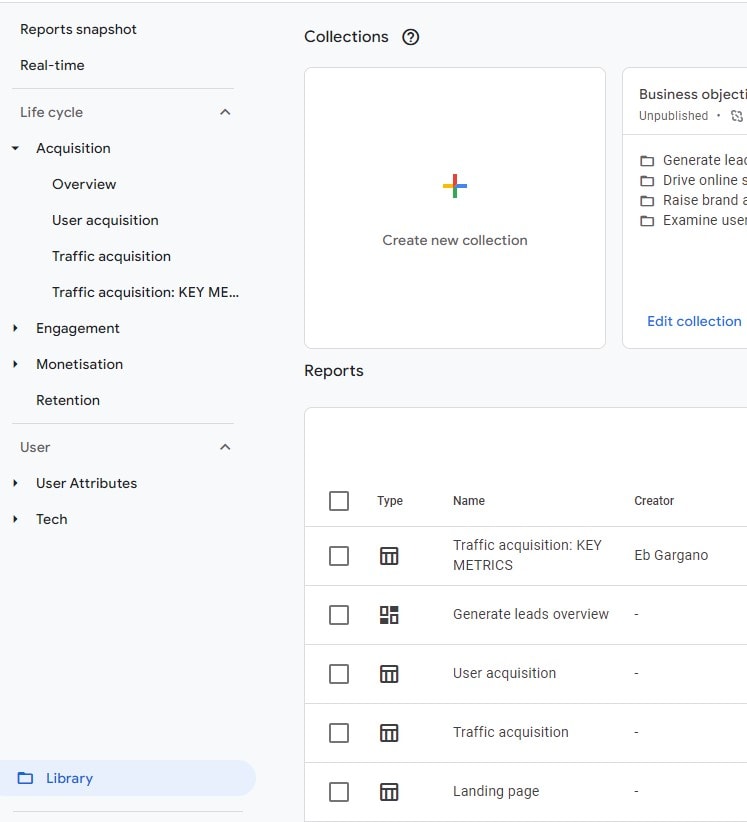
You can then find your new report in the ‘library’ section on the left hand side…
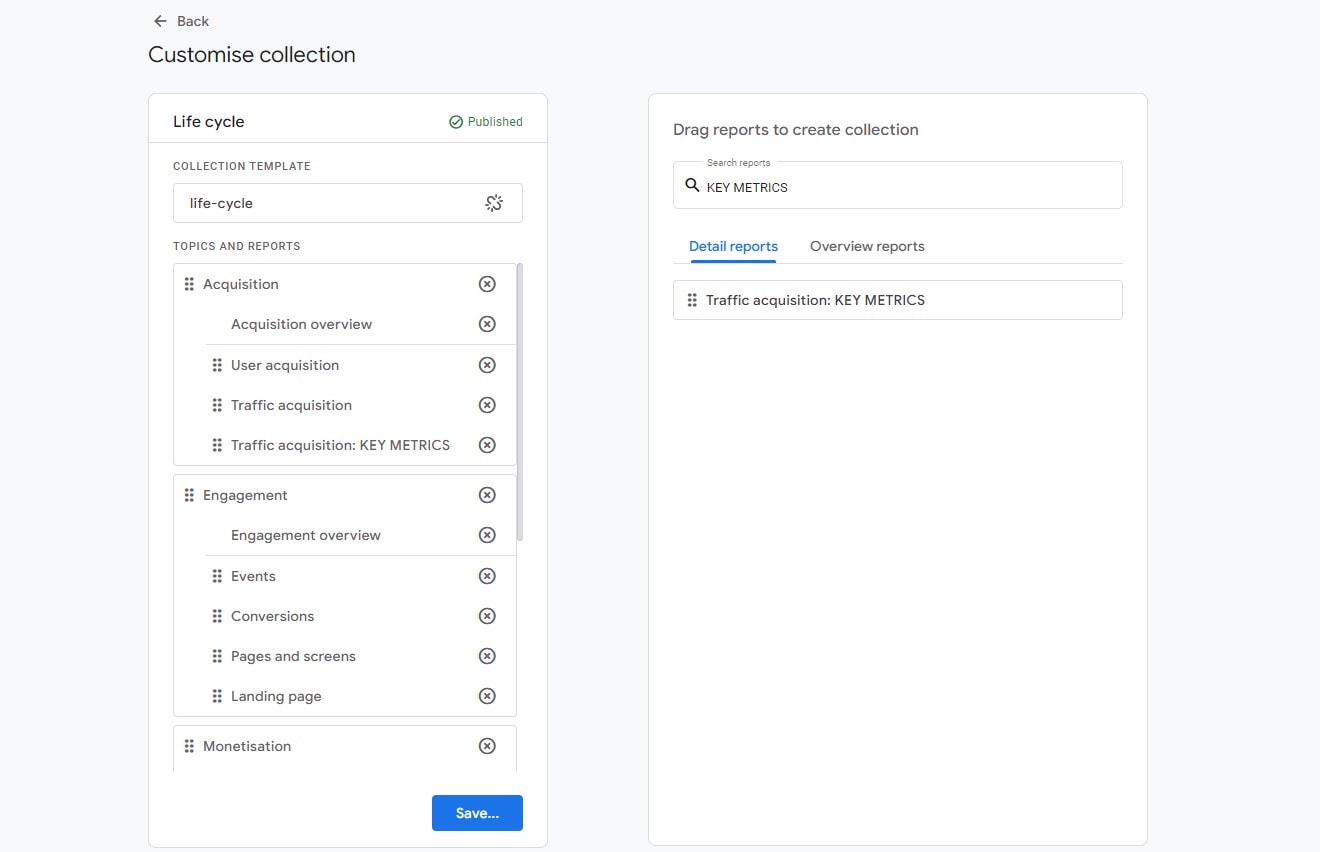
You can also move your new report into the appropriate section in ‘Reports’ by going to LIBRARY >>> LIFE CYCLE >>> EDIT COLLECTION. Then search for your new report and drag it to where you want it to appear.
3. 14 Months
The final thing to mention is that, by default, Google Analytics 4 only stores some data for 2 months.
You can adjust this setting by first going to ADMIN >>> PROPERTY >>> DATA SETTINGS >>> DATA COLLECTION. Where it says ‘User Data Collection Acknowledgement’ click on ‘I acknowledge’. (Make sure your privacy policy does cover this first!)
Next, go to ADMIN >>> PROPERTY >>> DATA SETTINGS >>> DATA RETENTION and choose 14 months instead of 2 months.
Congratulations
Congratulations on completing this tutorial. You should now have a good understanding of the basic reports in Google Analytics, as well as where to find basic data about your traffic, your readers, and your best and worst performing posts.
- How to set up Google Analytics 4 (from scratch)
- How to set up a new Google Analytics 4 property (when you already have a Google Analytics account)
- How to install the Google Analytics 4 tracking code (and check that it’s working)
Don’t miss a thing!
Follow me on Twitter, Facebook and Instagram. Or why not subscribe to Productive Blogging and get blogging and productivity tips straight to your inbox every week?
Pin this post to read later
Brilliant post – just what I needed – thank you. I’ve just skimmed through it, but I’m certainly going to come back and read it in a lot more detail.
Aw, that’s great to hear – so glad you found it helpful 😀
This post is a godsend! I’ve been having a lot of problems changing from Universal Analytics to GA4, but this was very helpful. Thank you for sharing!
Great to hear – you are welcome!
Thanks for simplifying Google Analytics.
You are welcome 😀